


 I was curios how much of the lovely internet I was using in a given time. The report I was able to pull up was quite revealing. I have Time Warner and my speeds are 20mbps download and 2mbps upload. I was curious how much do I use given a certain amount of time. I was able to see usage starting from May 4th, 2014. I guess Time Warner doesn’t allow the user to see any usage longer than 5 months or maybe they just don’t keep track.
Over the course of this time I used 1093 GB (gigabytes) of data. That is 1.07 TB (terabytes)! I have my TV hooked as my monitor to my computer and I do not pay for cable TV so everything I watch comes from the internet via streaming or other methods. Also, as soon as I get to my house my two iPhones (one for work and one for personal), and one iPad connects to my Wi-Fi. Between my work laptop, home desktop, 2 iPhones, and an ipad I have 5 devices that are always connected to my internet connection when I am home. When I am away from home my desktop is always on. All that being said I am going to get deep with some of these numbers because I love math and, well, let’s face it, I am a nerd.
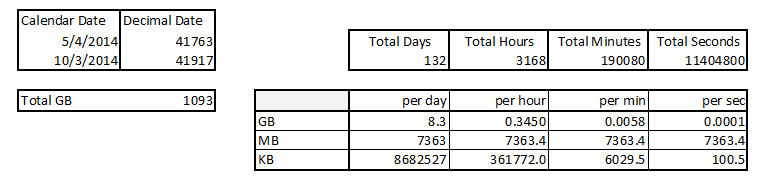
I have figured out that I use 87.3 kb per second. That is like downloading this picture (my face) every second of every day for 5 months. Yes, this image file is 87.3 kb in size. I actually took the time in photoshop carefully sized it down to that size.  If you take in consideration that I had my internet shut off for 20 days while I was on vacation. Then you take the original 152 days from May 4th to Oct 3rd;and get 132 days. If you take the 1093 GB divided by the 132 days you get 100.5kb per second. That is like downloading this image of my eye every second for 132 days. Bored yet? As you can see below the amount of data in GB, MB, KB per DAY, HOUR, MIN, SEC.
To sum it all up, I was kind of impressed with how much data I used and the fact that I could see that data usage in a nice little chart. Below are the actual screenshots from the data charts from Time Warner’s website. If you have Time Warner you can see your data by downloading the MyServices section on iOS or Android. UPDATE: They have moved this function to a mobile app.
Usage by DAY from 5/4/14 to 10/3/14
[This chart is best viewed when clicked and once it loads clicking it again to expand to full size.]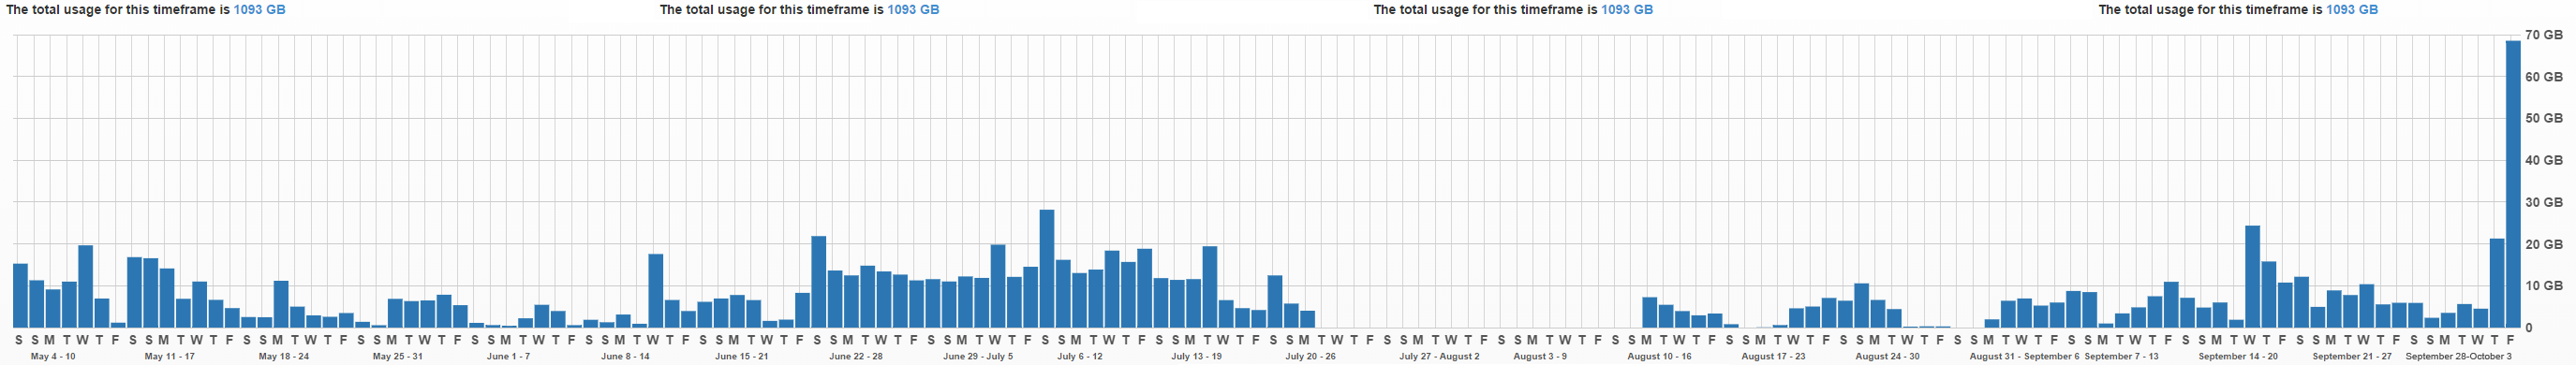
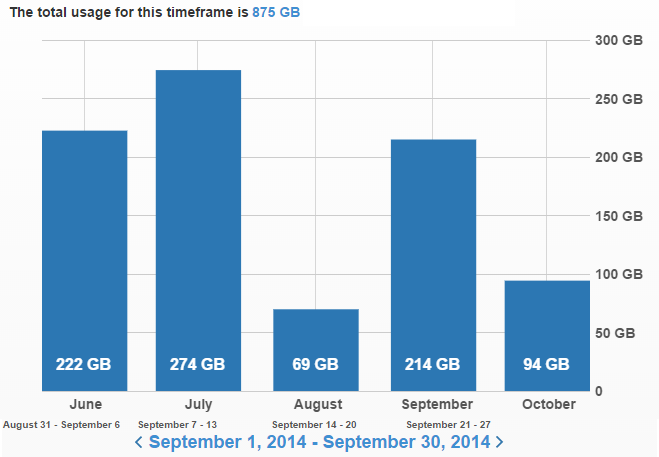
Usage by MONTH (May to Oct)
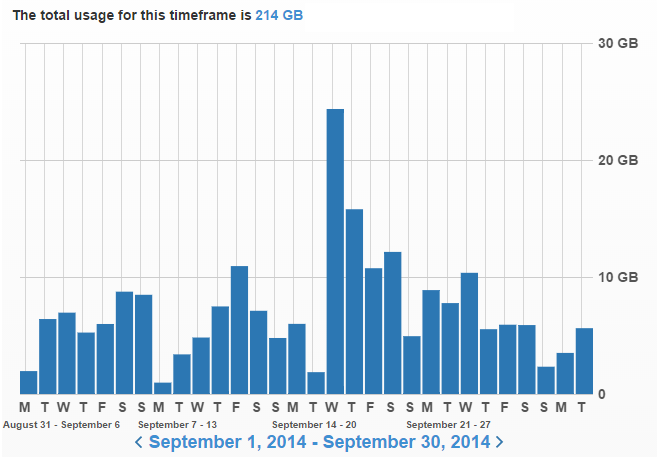
Usage by DAY (September)
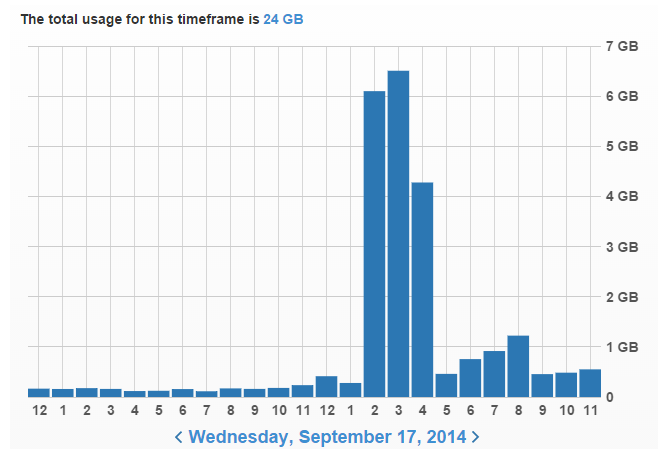
Usage by HOUR (Sept. 17th)
I hope you enjoyed this very nerdy look into my internet usage data. Let me know what you think below in the comments section.